Metatrader 4 webtrader offers traders a variety of chart types to visualize price movements and conduct technical analysis effectively. Each chart type has unique characteristics that cater to different trading styles and preferences, helping traders interpret market trends and make informed decisions.
Line Charts:
Overview: Line charts connect closing prices over a specified period, offering a simplified view of price trends.
Use Cases: Useful for identifying overall trends and basic support/resistance levels. However, they may lack detail compared to other chart types.
Bar Charts:
Overview: Bar charts display price movements using vertical bars that represent the open, high, low, and close prices for each period.
Use Cases: Provide more detailed information than line charts, making them suitable for analyzing price volatility, identifying key price levels, and evaluating market sentiment.
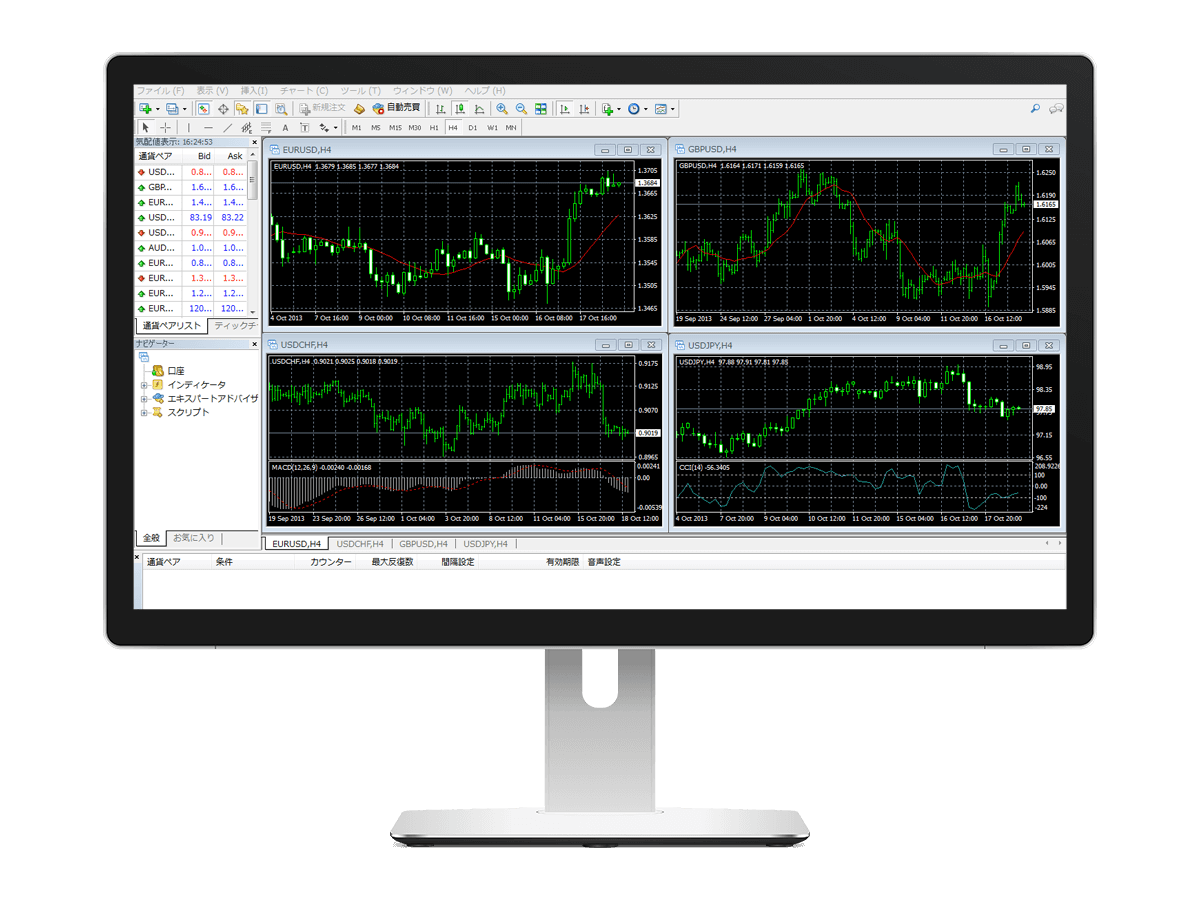
Candlestick Charts:
Overview: Candlestick charts are widely used due to their visual richness, showing the same price data as bar charts but with a more intuitive representation using candlesticks.
Components: Each candlestick represents the open, high, low, and close prices for a specific timeframe, with different colors (e.g., green/red) indicating bullish or bearish market sentiment.
Use Cases: Ideal for identifying reversal patterns (e.g., Doji, Engulfing) and confirming price trends, offering deeper insights into market psychology and trader sentiment.
Customizing Charts in MetaTrader 4 WebTrader:
Indicators and Tools: MetaTrader 4 WebTrader allows users to apply various technical indicators (e.g., moving averages, RSI) and drawing tools (e.g., trendlines, Fibonacci retracements) directly on charts to enhance analysis.
Timeframes Compatibility: Chart types in MetaTrader 4 WebTrader seamlessly integrate with different timeframes, enabling traders to switch between views effortlessly and adapt strategies based on market conditions.
Conclusion:
Understanding the nuances of chart types in MetaTrader 4 WebTrader empowers traders to conduct thorough technical analysis and make well-informed trading decisions. Whether you prefer the simplicity of line charts, the detail of bar charts, or the visual clarity of candlestick charts, leveraging these tools effectively enhances your ability to interpret market dynamics, identify trading opportunities, and manage risk in the ever-changing financial markets.